Introduction
This article presents the development of a reliability digital twin designed for a data communication system. AeROS utilizes this digital twin to implement Consecutive K-out-of-N logic for conducting RAM (Reliability, Availability, and Maintainability) analysis.
For a Consecutive K-out-of-N system to function properly, it is essential that at least K items within any consecutive group of N items are operational. For instance, consider a Consecutive 1-out-of-2 (K=1, N=2) system, where a long chain of items is connected in series from a reliability standpoint. As long as at least 1 unit is operational within any 2 consecutive items, the system is considered to be functioning.
In practical scenarios, when an item fails, it can significantly impact the system's efficiency even if the system remains available. This article emphasizes the misleading nature of relying on Availability as a reliability metric in RAM analysis. Instead, the article strongly advocates for adopting Efficiency, as defined in AeROS software, as a more suitable and accurate approach to evaluate a system's reliability performance concerning the quality of service it provides. By considering Efficiency over Availability, a more comprehensive understanding of the system's reliability and its impact on overall performance can be achieved.
The Scenario
In a remote stretch of jungle, there exists a data communication system serving two cities. This system consists of six relay stations strategically positioned to enable signal transmission from one station to the subsequent two stations in the line.
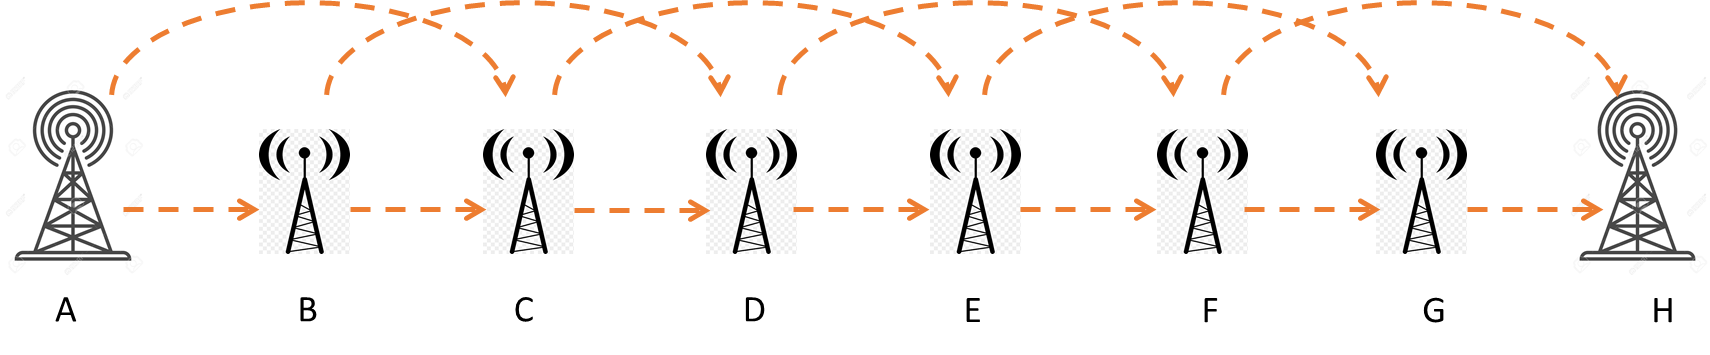
For instance, let's focus on Station-A as an example. The data signal transmitted from Station-A can be received simultaneously by both Station-B and Station-C. The data throughput from Station-A to Station-B is 100%, while the throughput from Station-A to Station-C is 40%. Moreover, if the data signal successfully reaches Station-C through Station-B, the direct signal from Station-A to Station-C becomes redundant.
Consequently, a failure in any one of the relay stations reduces the data throughput to only 40%. The system will only fail if two consecutive stations fail simultaneously.
The Assumptions
- The two base stations located in the cities are assumed to be free from any failures.
- All relay stations are identical and have a Mean-Time-Between-Failures (MTBF) of 2 years.
- The repair time follows an exponential distribution with a Mean-Time-To-Repair (MTTR) of 15 days.
Based on these conditions, our objective is to estimate the availability and efficiency of the system.
Use Efficiency as a metric to measure the Quality of Service for a complex system
The Approach
To estimate both the availability and efficiency (quality of service), we adopt a simulation approach. This method involves utilizing a reliability digital twin, which encompasses the logic that describes the reliability-based connections between sub-systems.
Within the digital twin, we also find the reliability and maintenance settings for the various sub-systems.
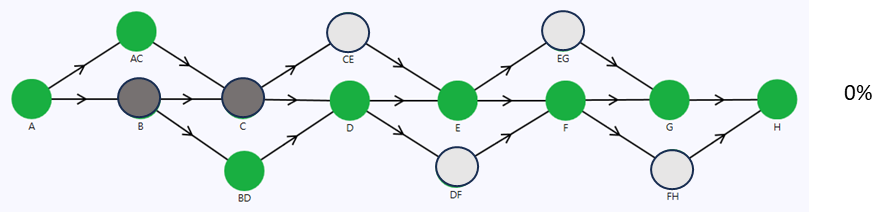
Below, you can find the reliability digital twin representation of the communication system.
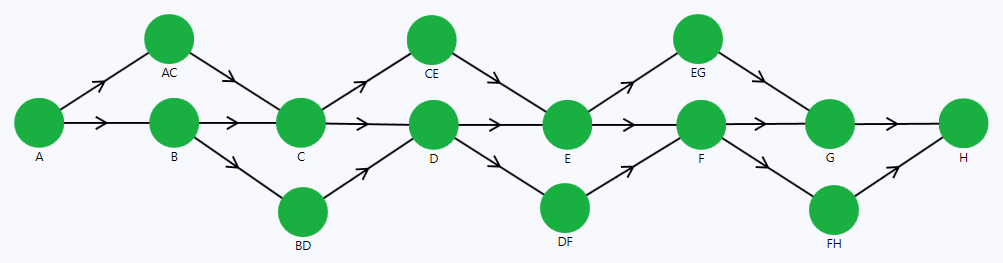
The nodes A, B, C, D, E, F, G, and H are associated with their respective physical stations in the system.
On the contrary, nodes AC, BD, CE, DF, EG, and FH do not correspond to any physical assets. I refer to them as “helper” nodes. For instance, helper node AC serves as the communication link between stations A and C, supporting a flowrate of 40%. Hence, node AC functions as a backup for node B, with a lower capacity.
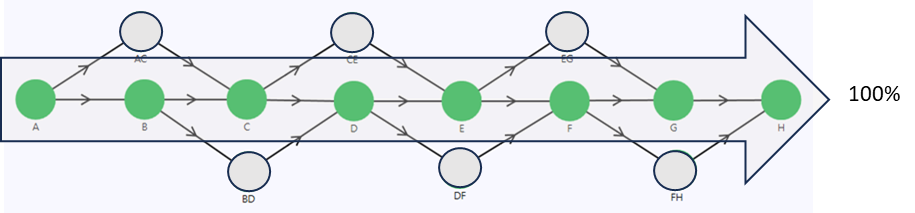
Under normal operating conditions, where stations B, C, D, E, F, and G are all operational, the data signal transmission path follows: A, B, C, D, E, F, G, and H, achieving a 100% throughput (flowrate), as illustrated in Figure 3.
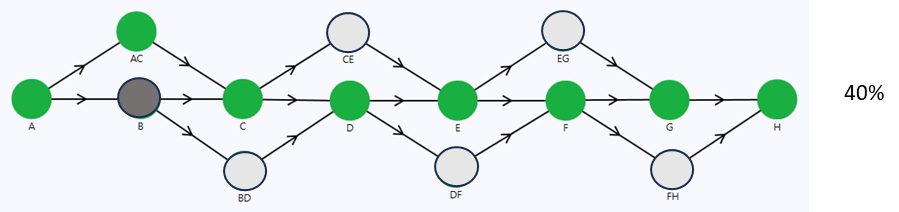
In the event of station B failure, the data signal transmission path is rerouted through stations A, AC, C, D, E, F, G, and H. However, the flowrate is limited by node AC, leading to a reduction of 40%, as illustrated in Figure 4.
The system's complete failure occurs only when a minimum of two consecutive stations fail at the same time. In the event of both station B and C failing simultaneously, as depicted in Figure 5, a continuous path from station A to H becomes impossible, resulting in a system outage.
The nodes’ 'Reliability' and 'Corrective Maintenance (CM)', as well as the standby logic of helper nodes are integrated into the digital twin, although we won't delve into the details here.
A 2-year simulation is run with 1000 executions with the “Addition Options” settings, as depicted.
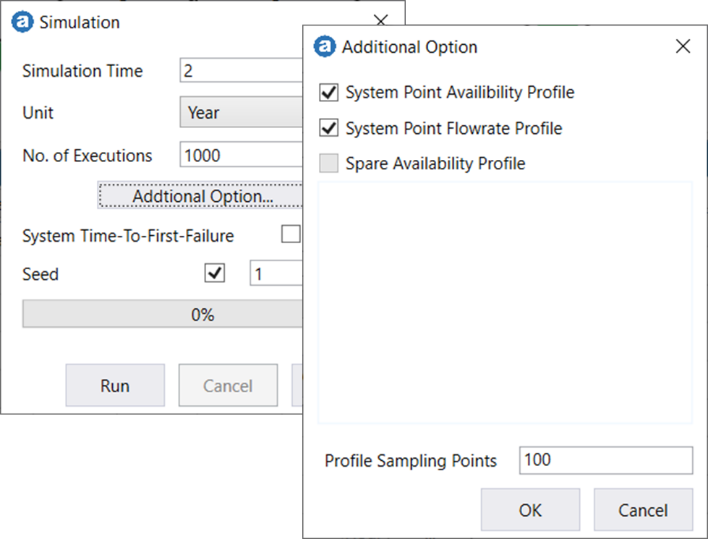
For this setting, the simulation generates and stores performance metrics for each execution. The simulation results are the collection of these metrics averaged over 1000 times.
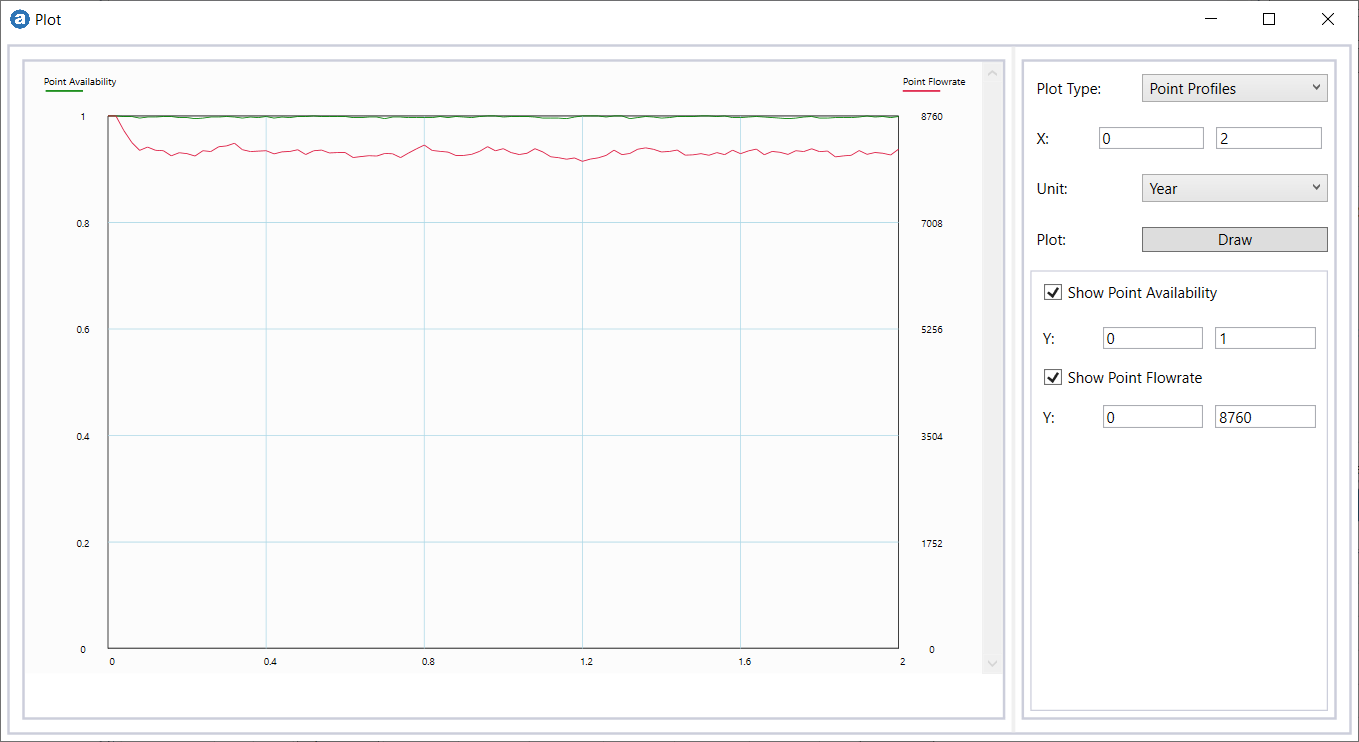
The resulting availability and efficiency values are 0.998 and 0.929, respectively.
Conclusion
The system demonstrates an impressive availability value; however, its efficiency (quality of service) falls short at 92.9%, highlighting significant room for improvement.
A comprehensive system reliability analysis should offer valuable insights into the health of assets. Equally important is the analyst's understanding of which metrics to employ while measuring the "Quality of Service" of the system. By utilizing the right metrics, one can gain a deeper understanding of the system's performance and identify areas that require enhancement.
-End-