This example analyses the production downtime impact due to spare restock-triggering policy, and lead-time constraint.
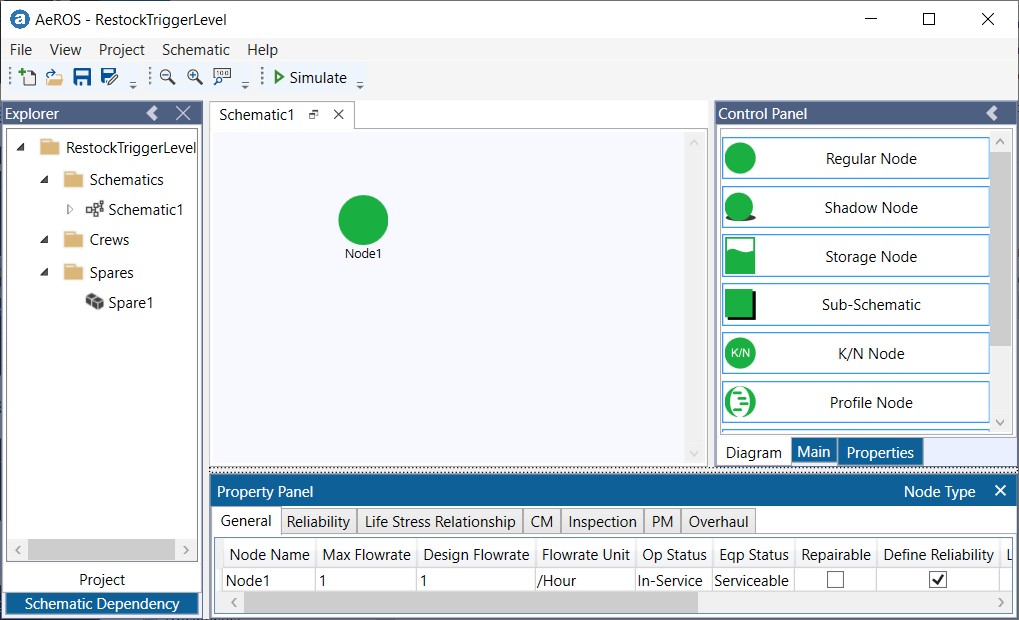
Figure 1, shows a network that contains only 1 equipment, Node1.
We setup the spare resource for Node1 with its current policy as a basis for sensitivity analysis.
Followings are the assumptions.
The restock lead-time of a spare is 60 days and the consumption rate follows exponential distribution with mean = 30 days.
When the inventory level falls to 2 units, a restock order is triggered. (The order quantity is not relevant in this example)
If spare is not available when a failure occurs, production will stop. Assuming that the corrective maintenance time is negligible if spare is available, estimate the production downtime due to spare unavailability.
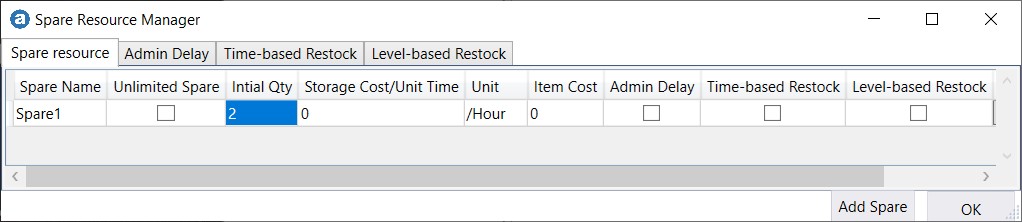
A Spare Resource is created (Project -> Manage Spare Resource -> Add Spare). The Initial Qty is set to 2. The default name of this resource is Spare1.
The schematic consists of only one Regular Node (Node1).
Reliability of Node1 is set to Exponential with MTBF = 30 days.
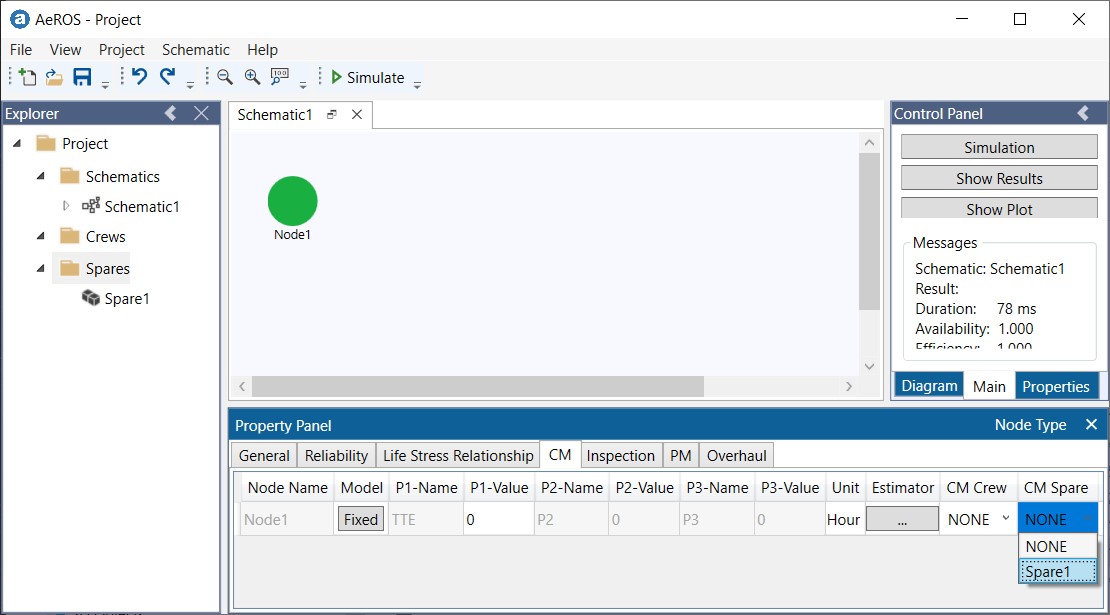
CM (Corrective Maintenance) to Fixed with TTE (Time-to-Event) = 0 hour.
Spare resource “Spare1” is assigned to CM Crew as shown below.
We want to know for a 60 days duration (which is the restock lead time), with initial quantity N = 2, what is the average duration where Node1 is down due to unavailability of spare.
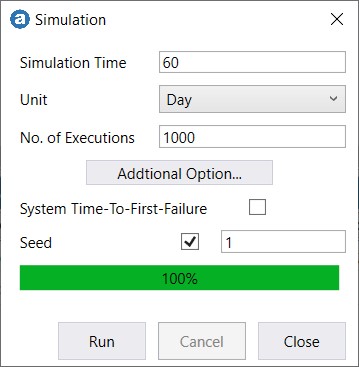
Run a 60-days simulation with 1000 executions.
From Control Panel, click on Show Results button. Click on Spare tab in Simulation Results dialog.
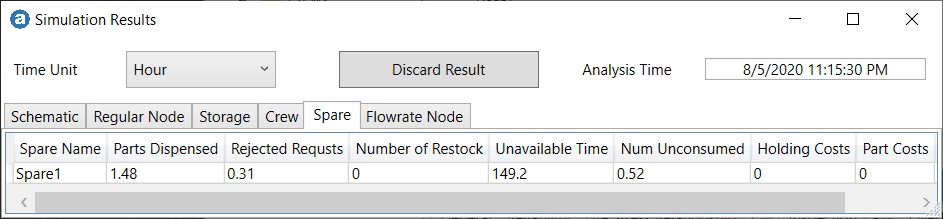
The average time that the node is down due to unavailability of spare is 149 hours (Under Unavailable Time column).
That is, if you trigger a re-order when there are 2 spares, you take the risk of 149 hours of downtime (on average).
The above simulation set the restock triggering level at 2. You can re-run the simulation with different levels and estimate the corresponding downtime.
The following table shows the downtimes for the corresponding restock trigger level.
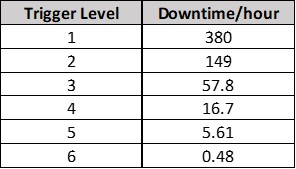
This analysis allows manager to decide the order quantity (given the restock lead-time is 60 days) for associated risk in term of downtimes.
-End-