A Poisson Process means the events (failures) inter-arrival times follow exponential distribution, that is, these times are random with constant failure rate.
A Non-Homogeneous Poisson Process with Power Law means the events inter-arrival times follow exponential distribution, but its failure rate u(t) changes with time, according to Power Law (N=λtβ).
u(t)=dN/dt = λβt-1
The assumption in this model is that the (repairable) item has infinitely many failure modes (not true in general). Analyst should exercise caution when extrapolating for the results from the model.
Following example illustrates the impact of the above assumption by comparing results using recurring data analysis (NHPP with Power Law) and simulation approach for a system made up of limited renewable components (failure modes).
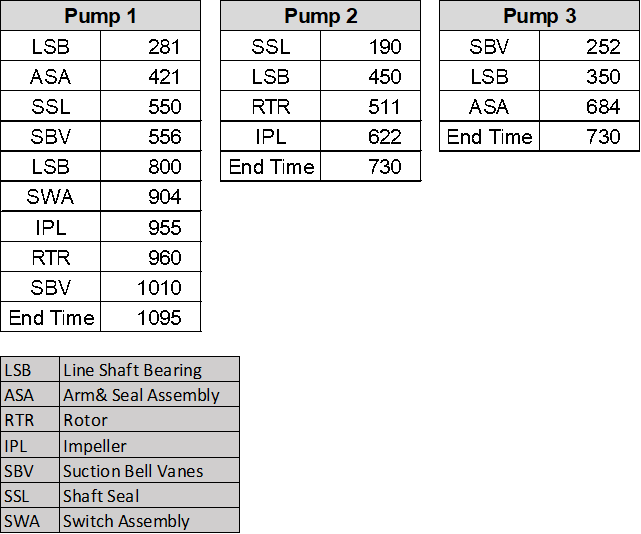
Followings are the historical failure records for 3 pumps working under similar stress condition. Pump 1 has been operating for a year, while pump 2 and 3 have been operating for 2 years.
First, we use recurring data analysis to obtain the NHPP model parameter which allow us to query for future events (failures). Note that the failure modes are ignored in recurring data analysis.


β greater than 1 implies the pump failure rate increases with time.
The model allows us to extrapolate into the future to estimate failures in the next time interval.
Next, the same system is analyzed using System Reliability approach. We construct the pump system reliability model in terms of its components and generate the failures over 5 years period through simulation.
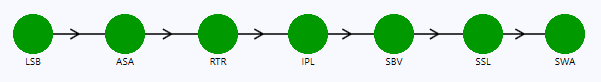
The pump has 7 failure modes (Figure 1): LSB, ASA, RTR, IPL, SBV, SSL and SWA.
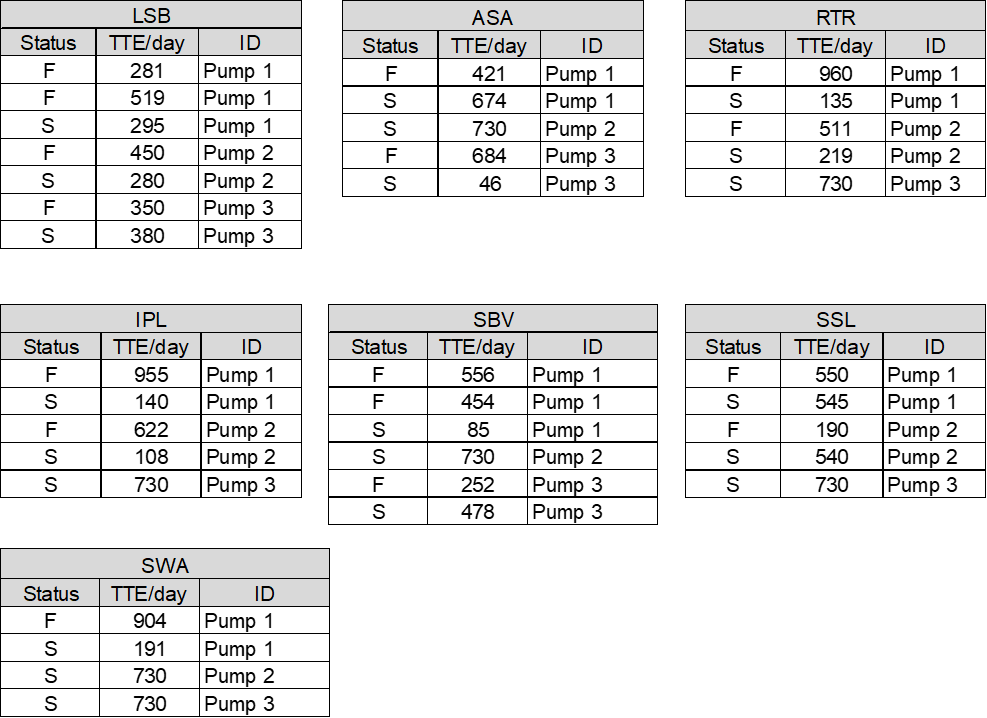
Time-To-Failures for each failure mode are extracted from the historical data.
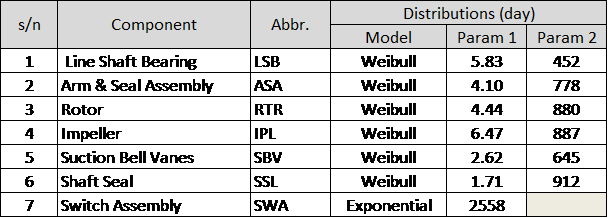
The datasets are fitted to distribution model using LDA module in Weibull Toolbox. Following is the LSB (Line Shaft Bearing) dataset fitted to Weibull distribution, as an example.
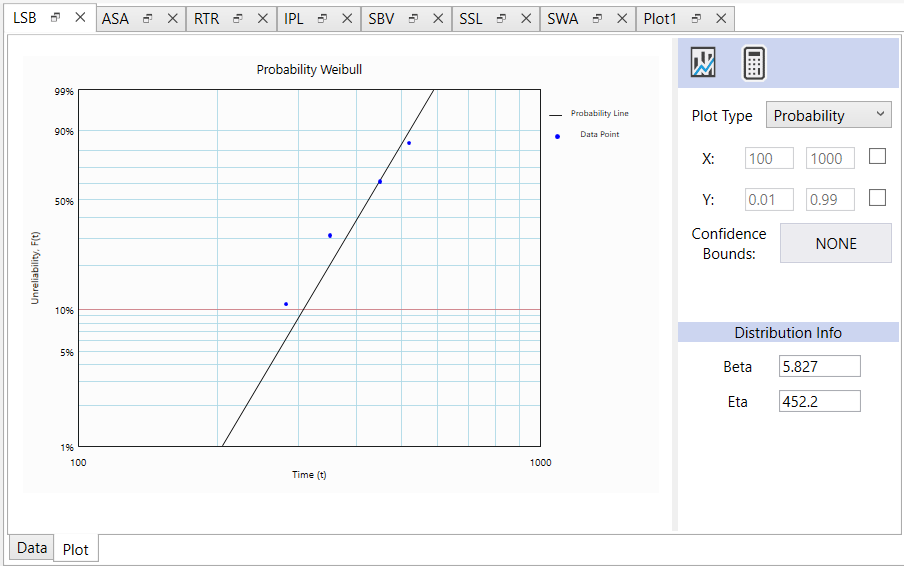
The analysis is repeated for the other components. Following is the summary of the pump components’ failure distributions.
The pump system reliability is modeled in AeROS software.

Run a 5-years simulation with 1 execution and the sequence of failures is obtained from the Tri-State plot.

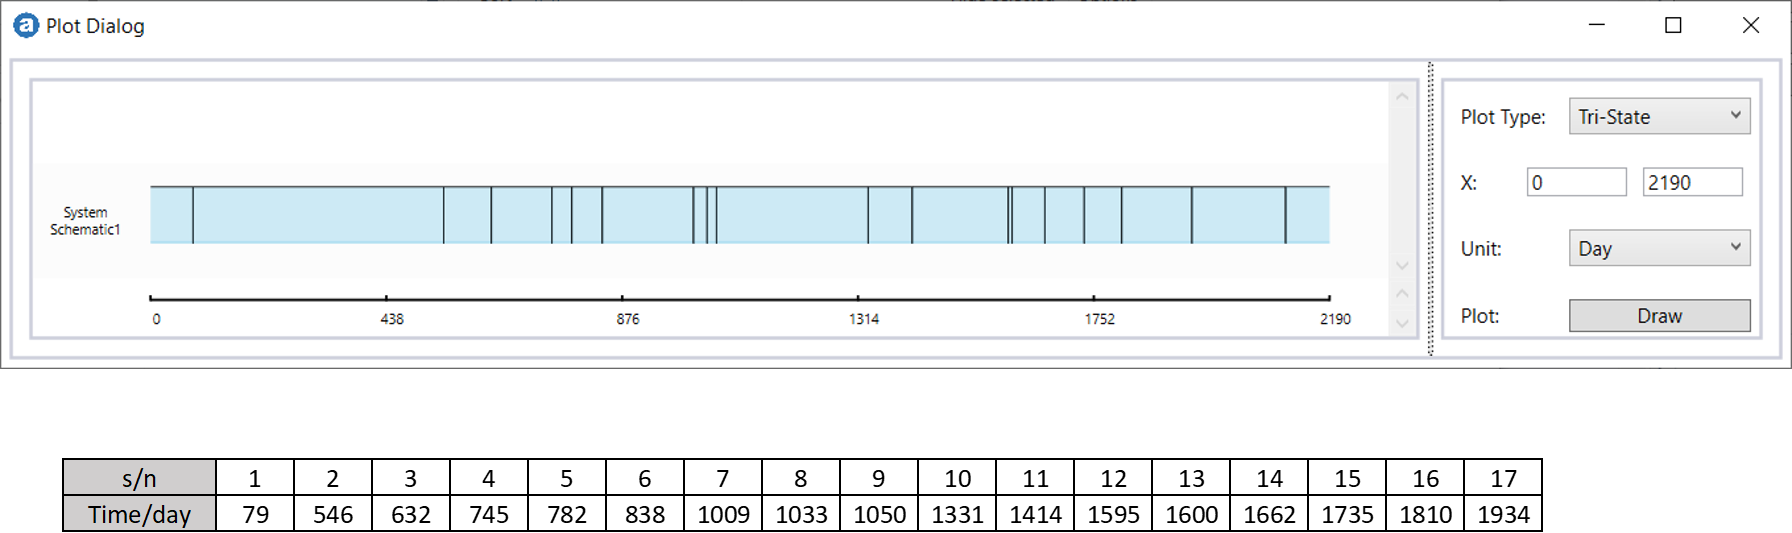
This cumulative failure times (Green) are superimposed on the Cumulative Failures vs Time plot in Figure 3.
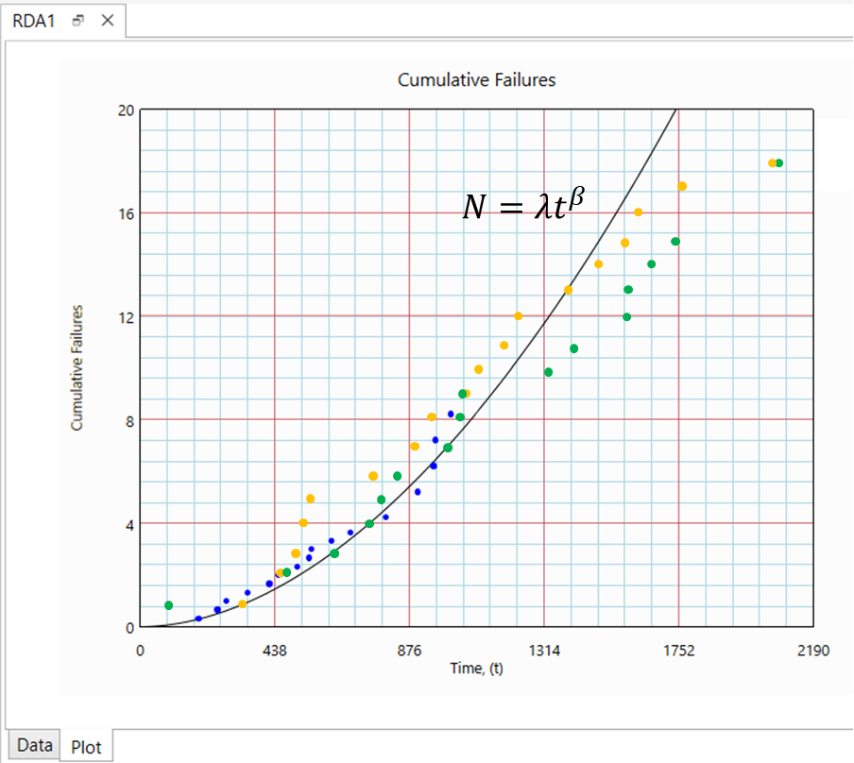
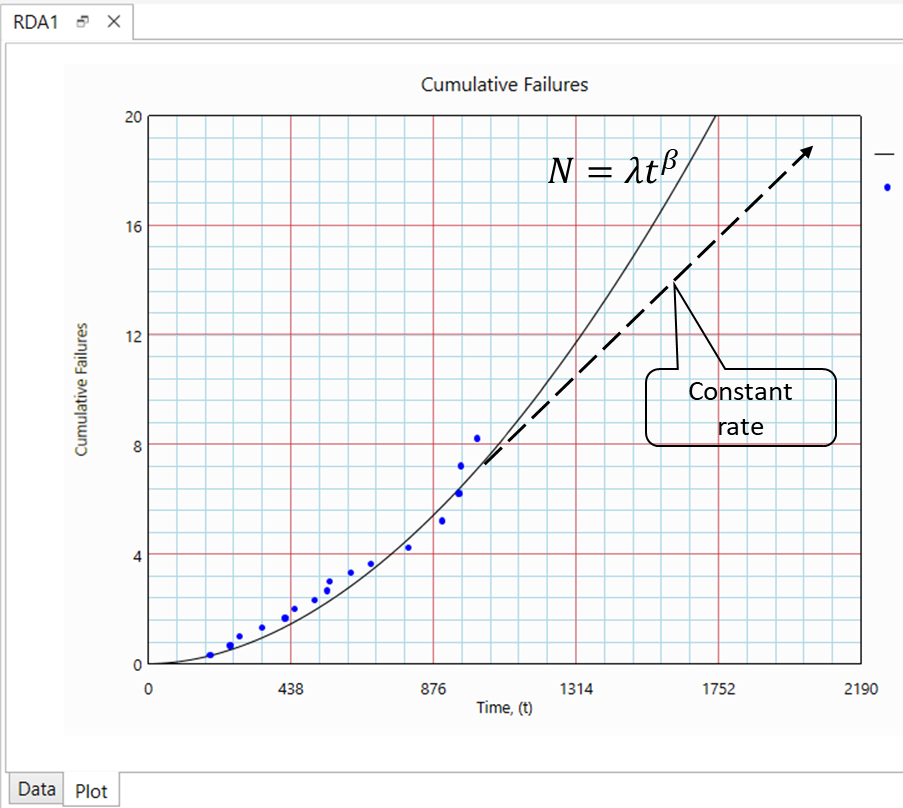
Since there are limited number of failure modes, the simulated data will eventually arrive at constant failure rate, while the Power Law (with β>1) curve will continue to band upwards.
Conclusion
Recurring Data Analysis is significantly easier compared to System Reliability approach. In most practical cases, data are not collected at the lowest actionable item level, as such, only recurring data analysis approach is available for failure projection. Analyst should be aware that this model assumes the (repairable) item has infinitely many failure modes, which is not true in general. Hence analyst has to exercise engineering judgement when extrapolating for the results from the model.
-End-