Introduction
Accelerated Life Testing (ALT) estimates reliability at normal use conditions from tests conducted at higher stress. Raising temperature, voltage, load or another relevant stress can produce failures sooner, reducing the time needed to learn about a product's life. The analysis then uses a life-stress relationship to extrapolate from the accelerated conditions to the intended use condition.
This introductory example combines an Arrhenius life-stress relationship with a Weibull lifetime distribution. The Arrhenius relationship is commonly used when temperature accelerates a thermally activated failure mechanism, while the Weibull distribution describes the variation in time to failure.
Experimental Setup
Temperature is the only accelerating stress. Nine units were tested at 350 K and six units at 450 K. Units that had not failed by 1,200 hours were recorded as right-censored (suspended) observations.
The objective is to estimate the lifetime distribution and reliability measures at 300 K, the intended use condition. Because 300 K is below both test temperatures, the answer is an extrapolation rather than an interpolation.
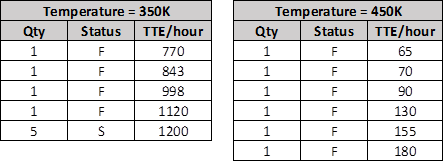
At least two distinct stress levels are needed to estimate a single-stress relationship. More levels and adequate failures at each level generally provide a better basis for checking the model form and quantifying uncertainty.
Life-Stress Relationship (LSR) Model
The analysis requires two complementary models:
- Arrhenius model for the temperature-life relationship
- Weibull distribution for time to failure
The Arrhenius relationship describes how characteristic life changes with temperature. Temperature must be expressed on an absolute scale, normally Kelvin. The Weibull distribution describes failure time through its shape parameter β and scale parameter η.
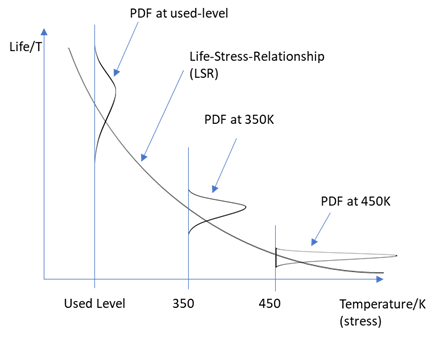
A life-stress equation is not selected only because the stress is temperature. Engineering knowledge must support the assumption that the same thermally activated failure mechanism operates at the accelerated and use conditions. If excessive stress introduces a different mechanism, the extrapolated life can be misleading.
The distance from the tested stresses to 300 K also matters: greater extrapolation usually means greater model risk and wider uncertainty. Confidence bounds and sensitivity to the selected model should therefore be considered when the result is used for a decision.
Verifying Distribution Assumptions
A common-shape Weibull ALT model assumes that β is the same at every stress level. Under that model, temperature changes the life scale but not the shape of the failure-time distribution. A strong change in β may indicate a different failure mechanism or an unsuitable distribution.
First, create separate Life Data Analysis worksheets for the 350 K and 450 K datasets. Their β point estimates are 4.5 and 2.9, but point estimates alone do not show whether the difference is meaningful because both datasets are small.
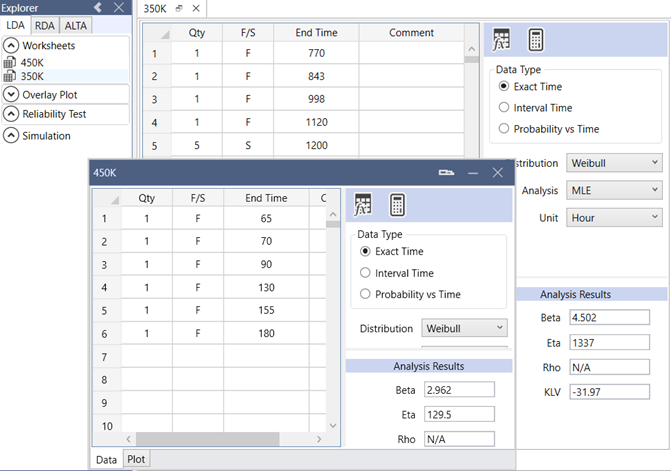
Accelerate the failure mechanism—not a different failure mechanism.
Add an Overlay Plot, select Contour as the plot type, and compare the parameter uncertainty regions for the two datasets.
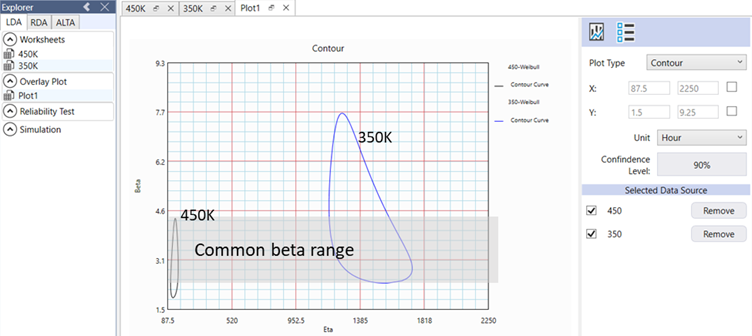
The contour regions overlap, so these data do not provide evidence that the β values differ. This supports proceeding with a common-β model, but it does not prove that the shape parameters are identical. The conclusion should be considered together with failure-mode evidence and engineering judgement.
With the assumptions not contradicted by the available data, the combined ALT model can now be fitted.
Model Estimation and PDF Derivation
In the FreeWeibull ALTA module, apply the following settings:
- LSR model: Arrhenius
- Lifetime distribution: Weibull
- Estimation method: Maximum Likelihood Estimation (MLE)
- Use condition: 300 K
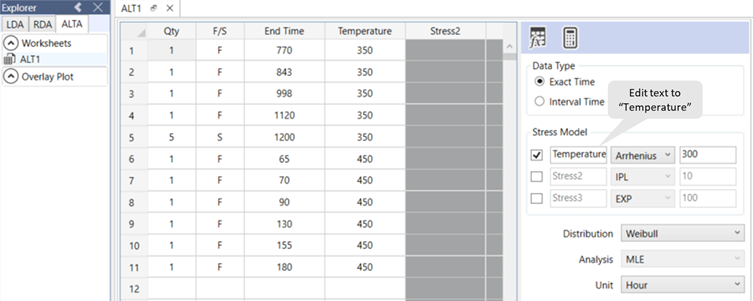
FreeWeibull fits the censored observations from both stress levels simultaneously by maximum likelihood estimation (MLE). The fitted parameters define the common Weibull shape and the Arrhenius relationship between temperature and life.
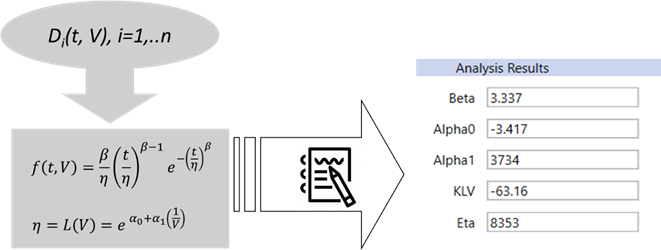
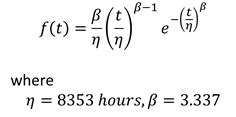
From that fitted relationship, FreeWeibull derives the Weibull probability density function at 300 K.
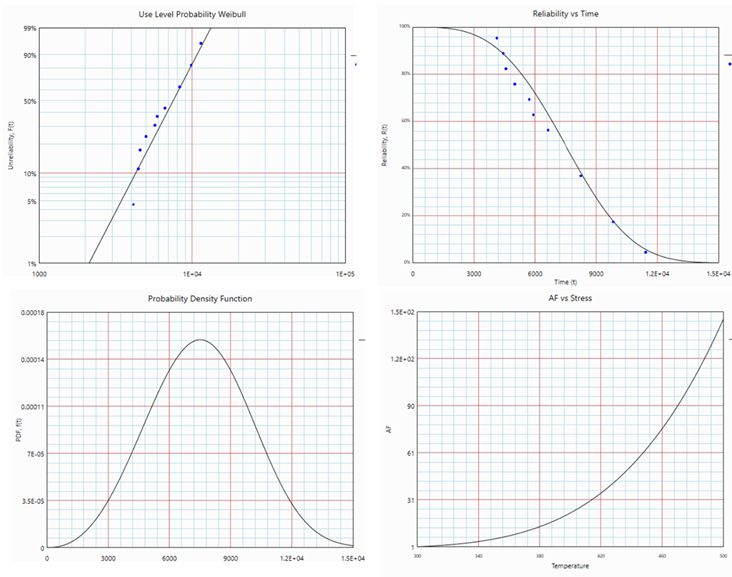
The fitted model can also produce the Weibull probability plot, reliability versus time, probability density, and acceleration factor versus stress at the selected use condition.
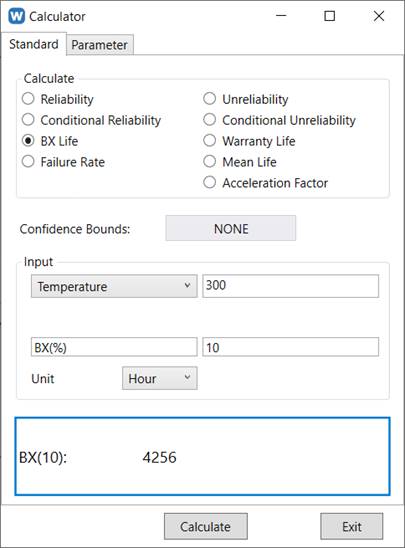
The ALTA Calculator converts the model into practical reliability measures. For example, B10 is the time by which 10% of the population is expected to have failed at 300 K. Treat this point estimate together with its uncertainty and the model assumptions, especially because 300 K lies outside the tested range.
Conclusion
ALT can shorten test time, but the calculation is only one part of a credible analysis. The physical failure mechanism, life-stress relationship, lifetime distribution, censoring and extrapolation range all affect the result.
A practical ALT workflow is to:
- Identify a stress that accelerates the relevant failure mechanism without changing it.
- Select a physically appropriate life-stress relationship and lifetime distribution.
- Plan tests at suitable stress levels and record failures and suspended units correctly.
- Check model assumptions, including the common-shape assumption where applicable.
- Fit the model, estimate reliability at the use condition, and evaluate uncertainty.
When reporting the result, document the assumptions and show uncertainty rather than presenting an extrapolated point estimate as a known service life.
Try Accelerated Life Test Analysis at FreeWeibull.com and view the FreeWeibull user guide.
— End —