Introduction
From a reliability standpoint, solar energy systems are generally resilient to failures. However, from an operational perspective, their stability is compromised due to dependence on weather conditions.
This presentation outlines a simulation-based approach to quantify how variations in (1) input energy, (2) load demand, and (3) storage utilization impact the availability of output energy.
The Scenario
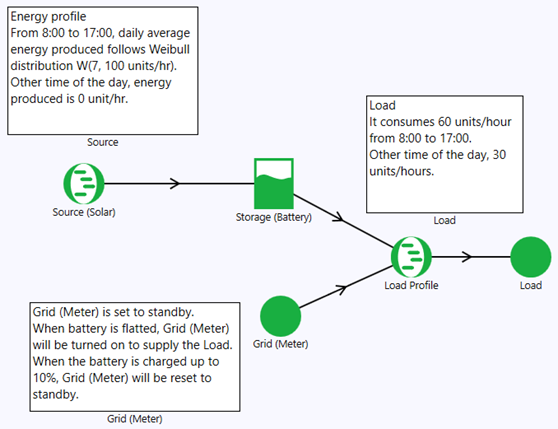
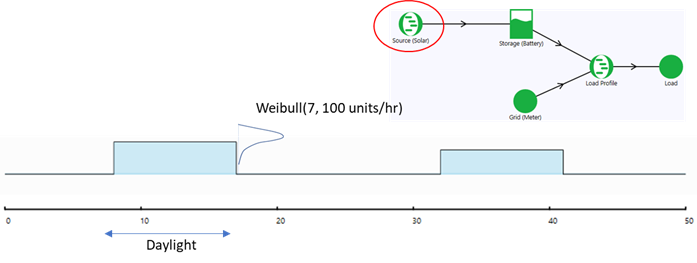
The system under study consists of a solar energy setup with battery storage, supplemented by traditional grid power to ensure uninterrupted supply to a load. Figure 1 illustrates the digital twin representation of this system, with energy units normalized for simplicity.
The digital twin includes:
- A schematic diagram defining the flow of energy
- The energy profile of the source Source (Solar)
- The battery settings (Capacity, charging/discharging rate)
- The energy consumption profile for the Load
- The logic to activate the backup Grid (Meter) when Storage (Battery) is depleted
Performance Analysis of Renewable Energy Systems Using AeROS™
Solar Panel Power Generation
The solar panel can only produce energy between 8:00 to 17:00 (9 hours) daily. The power is averaged over 9 hours.
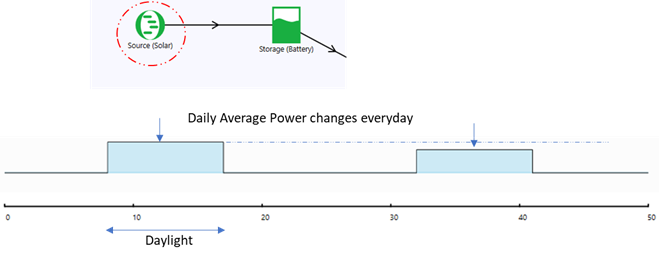
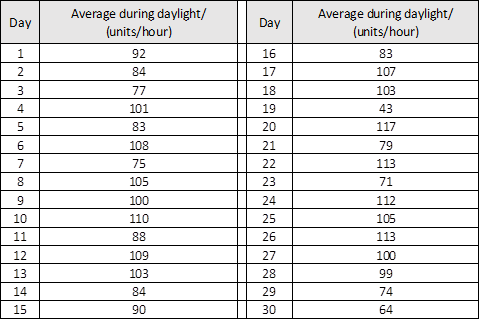
The Daily Average Power (units/hour), between 8:00 and 17:00 hours, was recorded over the past 30 days.
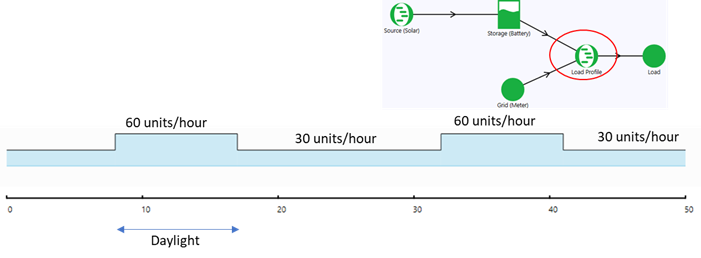
Load Power Consumption
The load consumes:
- 60 units/hour from 8:00 to 17:00
- 30 units/hour for the remaining hours
Key Questions
- How much power must be drawn from the grid?
- What is the battery’s usage profile?
The Approach
We start by creating an input energy profile for the Source (Solar) node as mentioned in Figure 2.
Statistical Modeling of Daily Average Power
The Daily Average Power dataset is fitted to a Weibull distribution (β=7, η=100 units/hour).
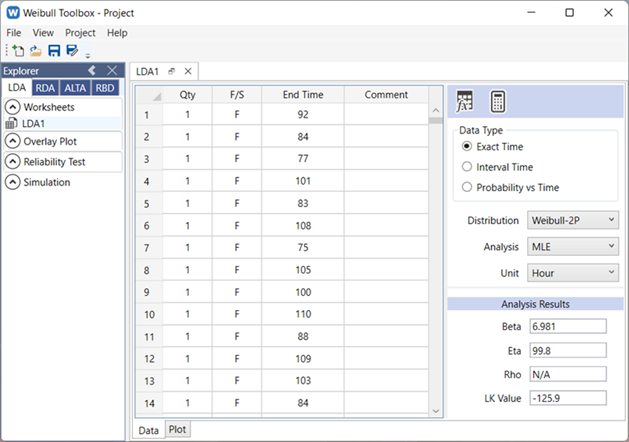
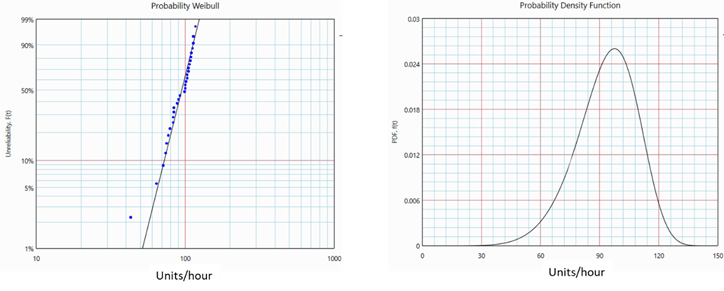
The mean Daily Average Power is 93.3 units/hour.
The Power Generation Profile for the Source (Solar) is created with Daily Average Power distribution.
Storage Capacity
The Storage (Battery) node is designed to store this amount of energy over 9 hours, which is 840 units (of energy).
Grid Activation Logic
Finally, the Grid (Meter) is set to standby and will be activated when the battery is depleted, and reset back to standby when the battery is being charged above, say, 2%.
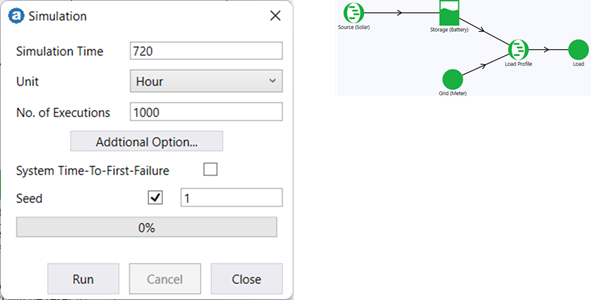
A 720 hours (1 month) simulation run with 1000 executions is conducted.
The Results
The simulation aggregates performance metrics over 1,000 executions, providing averaged results.
AeROS software provides an interesting visualization of operating profiles of individual nodes over the simulated period, as shown here.
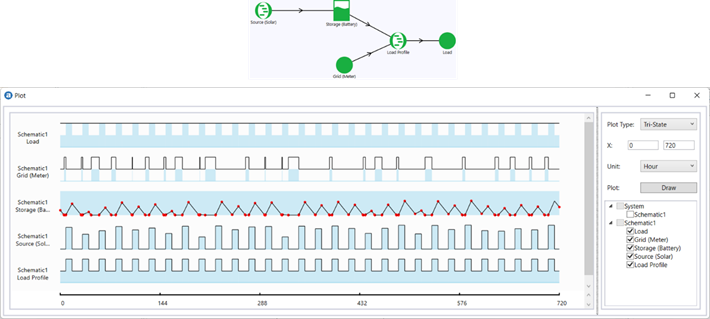
- Regular Nodes (Load, Grid (Meter)): Can be in Operating, Standby, or Out-of-Service states. Since no failures are modeled, they remain operational. The blue area indicates power consumption.
- Storage (Battery): Displays charging/discharging cycles.
- Profile Nodes (Source (Solar), Load Profile): User-defined operating profiles with blue areas representing power flow.
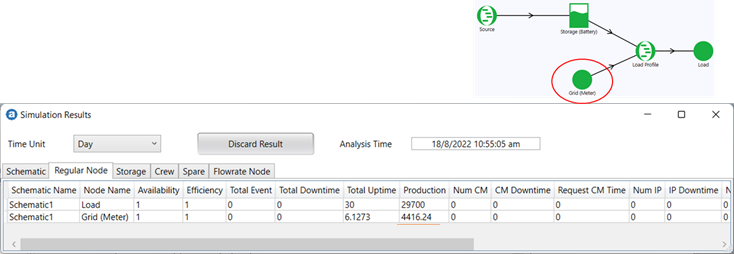
Grid Power Dependency
From the above figure, Grid (Meter) node supplies 4,416 units of energy over a month.
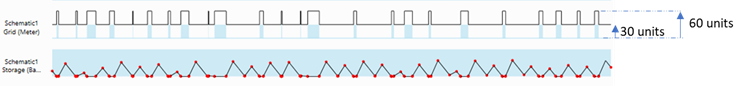
The Grid (Meter) node is turned on when the battery is depleted. Although it can supply 60 units/hour, only 30 units/hour are consumed. This is because the battery depletion occurs after daylight, and the Load consumption is reduced to 30 units/hour.
Battery Utilization

- Full Storage Days: Nearly zero
- Depleted Storage Days: 5.7 days/month
- Average Storage Level: ~18%
Energy Breakdown & Cost Analysis
- Total Load Consumption: 29,700 units/month
- Solar Contribution: 25,284 units (29,700 – 4,416 from grid)
- Estimated Cost: $4,416/month (assuming $1/unit)
If you are planning to double the capacity of the solar panel, how much more savings would this yield? How long would it take to recover your investment? These can be explored by adjusting the digital twin and re-running simulations.
Conclusion
This case study demonstrates a statistical approach to assess the operational dynamics of a solar power system, considering supply variability, demand fluctuations, and storage design. The AeROS™ tool enables cost-benefit analysis, scenario testing, and design optimization for such systems.
- End -