Introduction
Maintaining low spare part inventory levels is often desirable, especially for expensive items with high holding costs. However, this approach risks stockouts, leading to production losses quantified as penalty costs. A cost-optimized restocking policy is achieved when holding costs equal (or slightly exceed) penalty costs.
This case study demonstrates how AssetStudio's AeROS reliability analytics tool optimizes the restocking policy for a critical spare part, balancing inventory costs against the risk of shortages.
Cost Optimization Restock Policy
For cost optimization analysis, the following inputs are required:
- Penalty cost per day: The cost of running out of spare parts per unit per day
- Holding cost per day: The cost of storing one unit in the warehouse per day
- Demand model: The time-between-request distribution for spare parts
- Demand model: Demand model
The output provides a suggested policy and associated costs, including:
- Max. Level: Suggested maximum inventory quantity (warehouse + shipments)
- ROP (Re-Ordering Point): Inventory level that triggers an order
- Min. Level: Expected minimum inventory quantity
- Ave. Level: Average inventory quantity
- Achieved Serviceability: Probability of spare part is available
- Qty Consumed (Year): Average annual spare part consumption
- No. Restock (Year): Average annual restock frequency
- Penalty Cost (Year): Average annual penalty cost due to stockouts
- Holding Cost (Year): Average annual inventory holding cost
Example
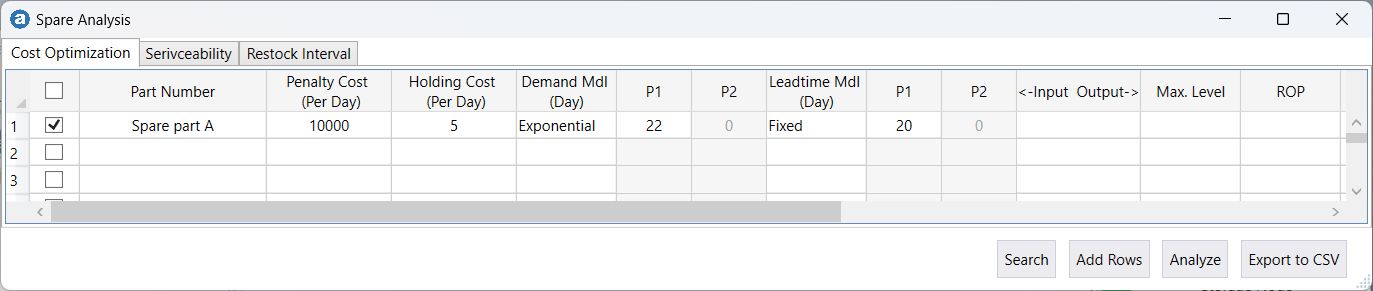
Consider a spare part A with:
- Holding cost: $5/day per unit.
- Penalty cost: $10,000/day (production loss if unavailable).
- Demand distribution: Exponential, with a mean time between requests of 22 days.
- Lead time Lead time : Average 20 days for delivery.
Question: What reordering policy minimizes total inventory costs?
Cost Optimization of Spare Part Restocking Policy Using a Simulation Approach
This data was input into AeROS’s Spare Analysis tool for simulation:
The simulation algorithm evaluates various Re-Ordering Points (ROP), calculating corresponding annual penalty and holding costs. The optimal ROP occurs when penalty costs equal or fall below holding costs.
The output results are shown below.
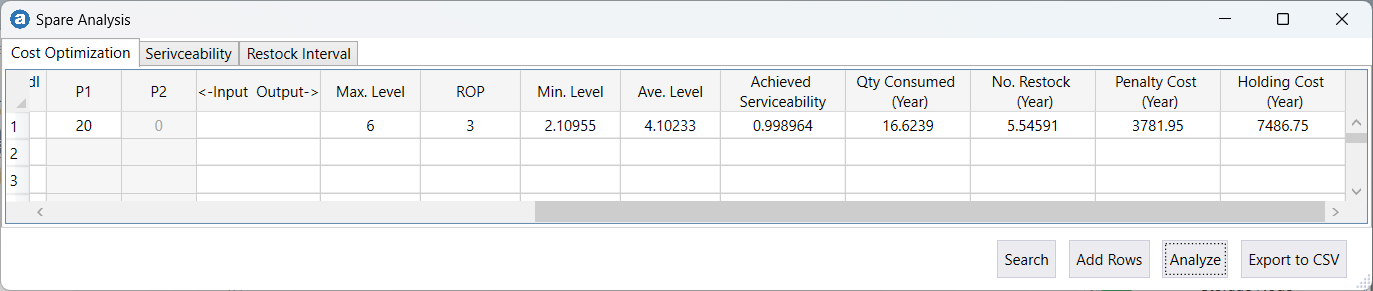
The tool supports batch processing (up to 500 items; this example analyzes one). The optimal strategy yields:
- Total annual cost (holding + penalty): ~$11.3k.
- Trade-off: Increasing ROP reduces penalty costs but raises holding costs, increasing total cost beyond $11.3k. Conversely, decreasing ROP lowers holding costs but increases penalties, also raising total costs.
The following plot shows the spare availability profile in the warehouse.
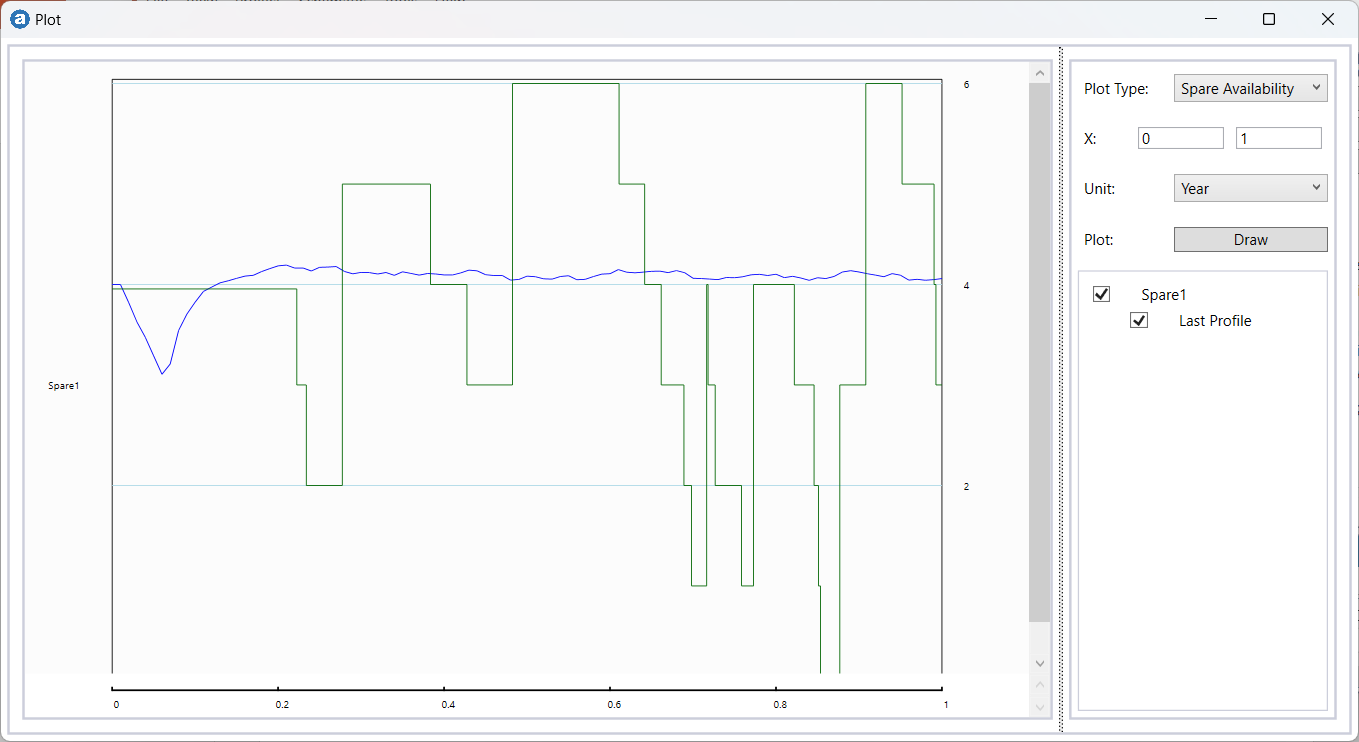
- Blue curve: Average availability across 5,000 simulations.
- Green curve: Spare quantity profile from the final simulation.
Comments
- Penalty Cost Challenges: Accurate penalty cost estimation can be difficult, as it depends on production downtime impacts. Some operators mitigate shortages through overtime or temporary production adjustments.
- Serviceability-Based Strategies: Some asset managers prefer setting a target serviceability (e.g., 95% availability, accepting a 5% stockout risk). AeROS’s Spare Analysis tool also supports this approach.
- End -