Background
A semiconductor manufacturer conducted reliability testing to determine the effect of thermal shock cycles on solder joint life (i.e., establishing how much operation time one thermal cycle represents). This case study demonstrates how Life Data Analysis addresses this challenge while introducing key reliability metrics like BX-Life and Confidence Bounds.
Test Scenario
800 surface-mount solder joints underwent repeated thermal shock cycling. Field data indicated a B(1) life* of 25 months. The analysis objective was to estimate the equivalent field duration (in days) per thermal cycle at an 80% confidence level.
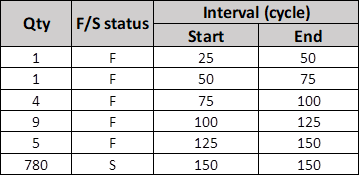
Joints were considered failed when resistance exceeded a threshold value (simplified for this presentation). Measurements occurred every 25 cycles, with testing concluding at 150 cycles (780 joints remained functional).
Test results summary:
* B(1) life definition: The time by which 1% of the population fails (a reliability metric).
Interval Data
The first row in Figure 1 shows the initial failure occurred between 25-50 cycles. This interval censored data type means we know the failure cycle range but not the exact value.
Interval-censored data indicates that an event is known to occur within a specific time interval, whereas right-censored data indicates that the event time is only known to occur after a certain time point.
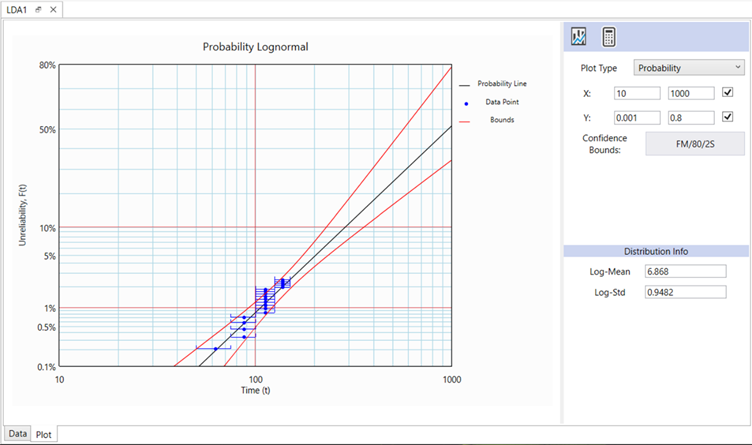
Analysis Methodology
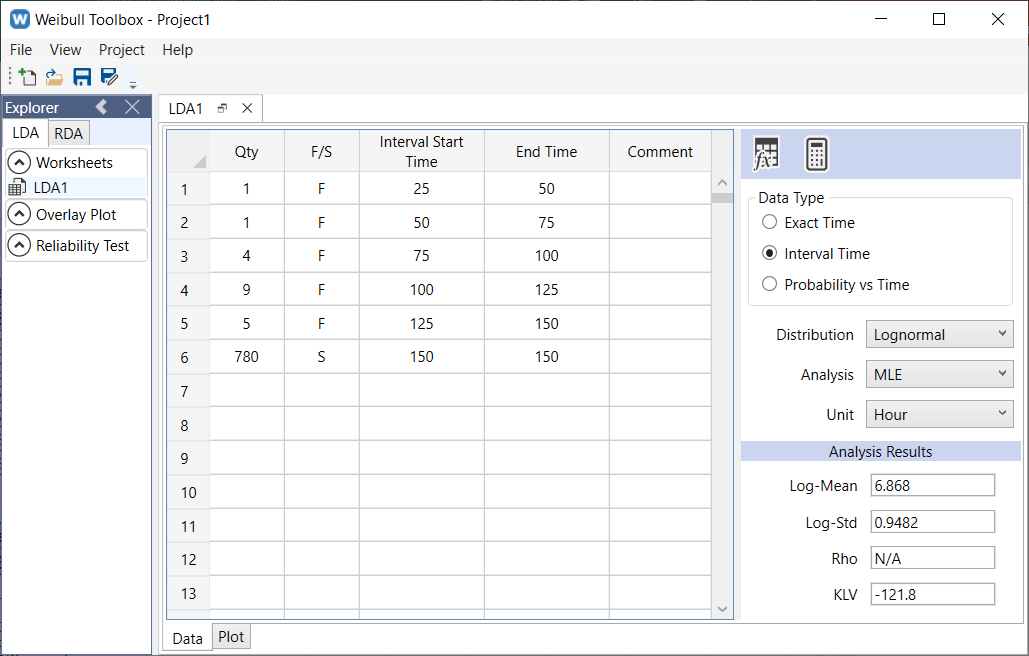
The Weibull Toolbox worksheet was configured with:
- Data Type: Interval Time (adds dedicated input column)
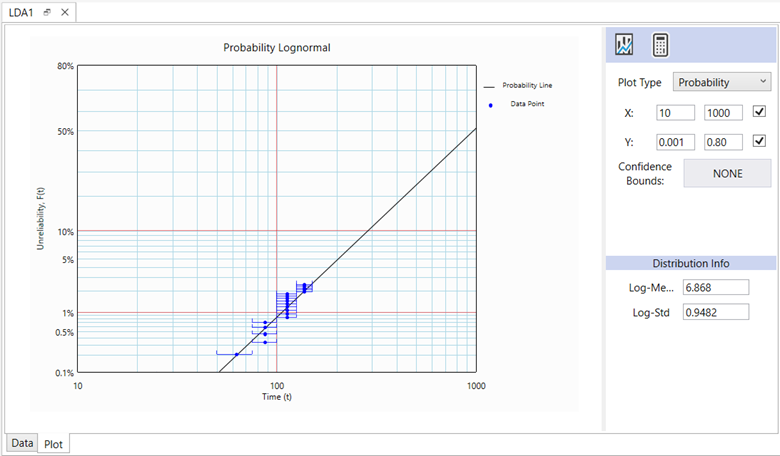
- Distribution: Lognormal (assumed for solder joint failures)
- Analysis Method: MLE (Maximum Likelihood Estimation, preferred for censored data)
- Unit: Hours (1 hour ≡ 1 thermal cycle)
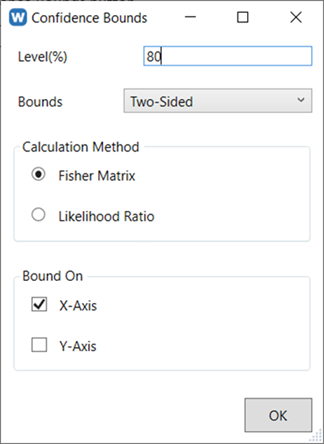
Confidence Bounds Analysis
80% two-sided confidence bounds were added to quantify uncertainty in the estimates:
Using Calculator to show B(1) life:
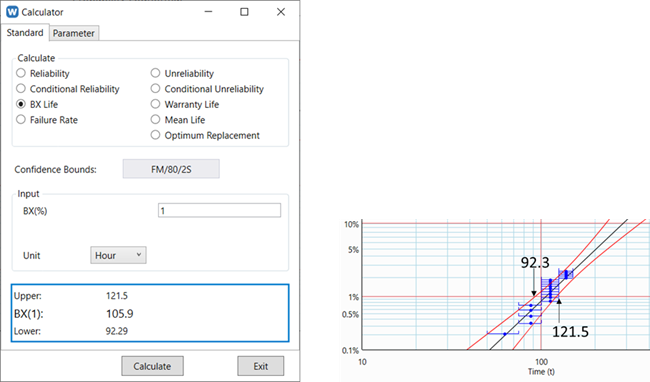
Key Results
B(1) life is 105.9 thermal cycle (also correspond to 25 months). Hence 1 thermal cycle is equivalent to 25 x 30 / 105.9 = 7.1 days.
The 80% confidence bounds for B(1) life are 92.3 and 121.5 cycles respectively. Hence, 1 thermal cycle is equivalent to, 6.2 days (25*30/121.5) to 8.1 days in the field with 80% confidence level.
Conclusion
By comparing field reliability data with laboratory test life data, the manufacturer quantified the effect of the thermal cycle-to-field operating time ratio. This information can be used to estimate the product's field life based on thermal cycle tests, thereby avoiding the need for a much more expensive Accelerated Life Test (ALT).
- End -